
Finance approved the offsite. The event happened. People said it went well.
Now someone is asking what it produced.
This is the moment most event planners dread - not because the event didn't deliver, but because "it went well" isn't a number. And in a budget conversation, numbers are what get listened to.
The good news: measuring offsite ROI doesn't require a data science team or a six-week analysis project. It requires deciding what you're measuring before the event happens, capturing the right information during and after, and translating it into language that finance and leadership actually use.
Here's how to do it quickly and credibly.
Start before the event, not after
The single biggest mistake in offsite ROI measurement is trying to build the case retrospectively. By the time someone asks "what did that produce," the baseline data that would make the comparison meaningful is gone.
ROI measurement starts at the planning stage with one question: what is this event supposed to change?
That question has different answers for different event types:
- A company-wide retreat: the answer might be "stronger cross-functional relationships and clearer alignment on Q3 priorities"
- A sales kickoff: "higher rep confidence in the new product messaging and a measurable lift in pipeline activity in the following quarter"
- A team offsite for a distributed group: "reduced friction in collaboration and stronger working relationships between people who've never met in person"
Once you've named the intended outcome, you can work backward to: what would it look like if this worked? And what data would show us whether it worked?
That question, answered before the event, is the foundation of a credible ROI assessment.
The three measurement categories that cover most offsite types
You don't need to measure everything. You need to measure the things that are most likely to move for your specific event type and that you can credibly connect to the event itself.
1. Engagement and sentiment
The most accessible measurement category for any offsite. Run a pulse survey before the event and repeat it 30–45 days after. Keep it short - five to eight questions - focused on the specific outcomes the event was designed to produce.
For a culture-building retreat, relevant questions might include: How connected do you feel to your team? How clear are you on the company's direction for the next six months? How confident are you in your ability to work effectively with colleagues outside your immediate team?
The before/after delta is your signal. You're not trying to prove causation - too many variables move in a 30-day window for that. You're looking for directional evidence that something shifted.
Pre/post engagement pulses are fast, free, and produce data that's genuinely useful for the next event design even when it's not strong enough to be definitive proof of ROI.
2. Behavioral indicators
Harder to measure than sentiment but more credible in a financial conversation. Behavioral indicators are things people did differently after the event.
For a sales kickoff: pipeline created in the 60 days following the event, compared to the same period in prior years. Deal velocity changes. Time from first contact to qualified opportunity.
For a leadership offsite: decisions that were made that had been blocked or delayed. Strategic initiatives that moved from "we should" to "we are."
For a culture retreat: cross-functional collaboration metrics S-lack activity between teams, project participation across department lines, meeting attendance patterns.
Not all of these will be available or meaningful for every event. Choose one or two behavioral indicators that are specific to your event's stated purpose and track them for 60–90 days.
3. Retention and stability signals
Longer-horizon but high-value. Voluntary turnover in the six months following a significant culture investment, compared to the six months prior. Engagement survey scores at the next cycle. New hire integration feedback from cohorts that went through an in-person onboarding experience versus those who didn't.
These aren't fast measurements - they take months to materialize. But they're the ones that matter most to HR leadership and finance, because they translate into actual cost avoidance. The cost of replacing a mid-level employee runs 50–200% of annual salary. If a $2,000/person offsite investment meaningfully improves retention in even a small number of cases, the ROI math closes quickly.
The cost side of the equation
ROI requires two sides: return and investment. Most organizations track the return imprecisely and the investment inaccurately - usually because the invoice total understates the true cost.
A complete cost picture for an offsite includes:
- Direct event costs: Venue, accommodation, catering, activities, AV, ground transportation, materials. This is what most people think of as "the event cost."
- Staff time: The hours spent planning, coordinating, and executing the event at fully-loaded cost. For a 75-person offsite with a mid-level planner spending 80 hours on it, that's $8,000–$15,000 in staff time that rarely appears in the budget.
- Participant time: Every hour your 75 attendees spend traveling to and attending the event is an hour not spent on their regular work. At fully-loaded cost, a two-day offsite for 75 people represents a significant implicit investment that should be acknowledged when assessing whether the outcome justified it.
- Travel costs: Flights, hotels, ground transportation for attendees. Often tracked separately from "event costs" but absolutely part of the total investment.
Using the complete cost picture produces a more honest ROI assessment - and one that's more credible with finance, because you're not understating the investment to make the return look better.
A simple ROI framework you can use immediately
For most offsite types, this four-part framework captures what you need without requiring sophisticated analysis:
- Before: Run a 5-question pulse on the specific outcomes the event is designed to produce. Capture baseline metrics for any behavioral indicators you plan to track.
- During: Collect qualitative signal - facilitator observations, informal feedback, attendance and participation rates. This won't go in the ROI report, but it informs the post-event survey design and helps you explain anomalies in the data.
- After (30 days): Repeat the pulse survey. Note any meaningful behavioral shifts. Compile the complete cost picture while the data is fresh.
- After (90 days): Review behavioral indicators. Note any retention signals. Produce a one-page summary: investment, intended outcome, what the data shows, what you'd do differently.
The one-page summary is the deliverable. It doesn't need to prove causation - it needs to show that you measured what you said you'd measure, and that the directional results justify continued investment.
What to do when the data is ambiguous
Sometimes the pulse data is flat. Sometimes the behavioral indicators don't show a clear signal. This doesn't mean the event failed - it might mean the measurement window was too short, the baseline was too recent to capture a meaningful delta, or the outcome the event produced wasn't the one you measured.
The honest response to ambiguous data is not to discard it or to spin it. It's to report what you found, note what you're uncertain about, and explain what you'd measure differently next time.
This kind of intellectual honesty in post-event reporting builds more credibility with finance and leadership than inflated ROI claims that don't hold up under scrutiny. The goal isn't to prove every event was a triumph. It's to build a measurement practice that makes each event more defensible than the last.
How BoomPop supports event ROI measurement
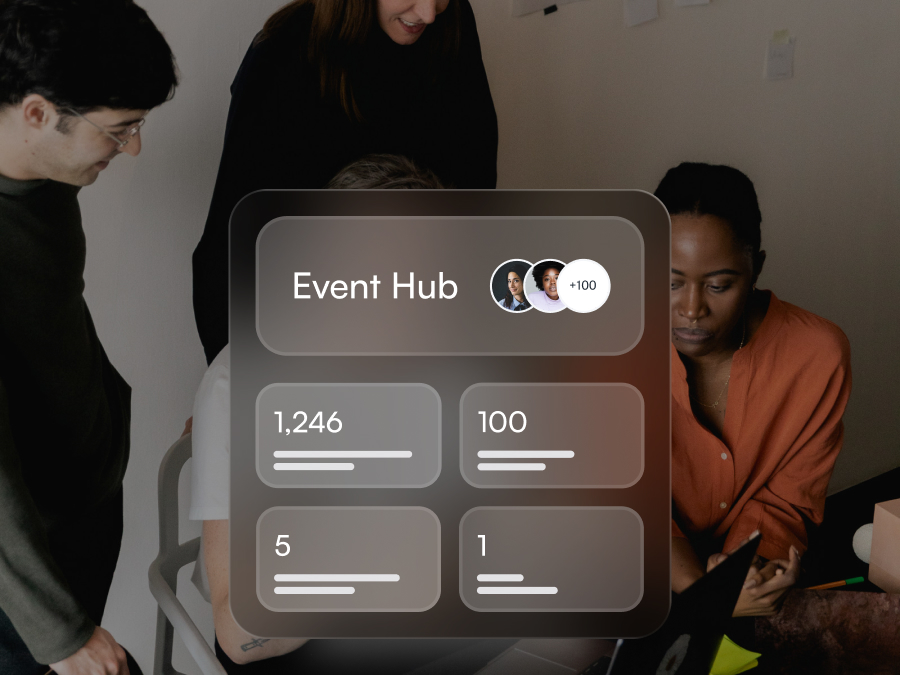
The measurement work described above is significantly easier when the cost side of the equation is already tracked. BoomPop's live budget dashboard maintains a running total of all event costs -vendor contracts, accommodation, catering, activities - so the complete investment picture is available without a post-event reconciliation project.
The platform also captures the data that feeds the qualitative side: attendance, guest feedback, event logistics performance. Combined with your organization's own pulse survey and behavioral tracking, it gives you the inputs for a credible ROI story without requiring you to reconstruct it from scattered sources after the fact.
And for events where the ROI stakes are highest - where leadership is paying attention to whether the investment produced real outcomes - BoomPop Studio's in-house event team can help design the event in a way that maximizes the likelihood of the outcomes you're trying to create. Better event design produces better ROI. The measurement just tells you how much better.
Start planning in 2 minutes or less


.avif)

.svg)